Want to know how many Canadians use recreational marijuana? How much people spent on cosmetics in the last ten years? How many Nike stores there are worldwide? Which industries are responsible for the most air pollution?
All of these questions and more can be answered with Statista!
What is it?
Statista is a provider of market and consumer data, and a great source for statistics. Statista contains over 1 million statistics and reports on brands, industries, regions, and societal issues.
Statista is also great when you need to do a report on a specific country or industry.
How do you use it?
There are a couple ways you can search Statista.
Method 1: Using the topics provided
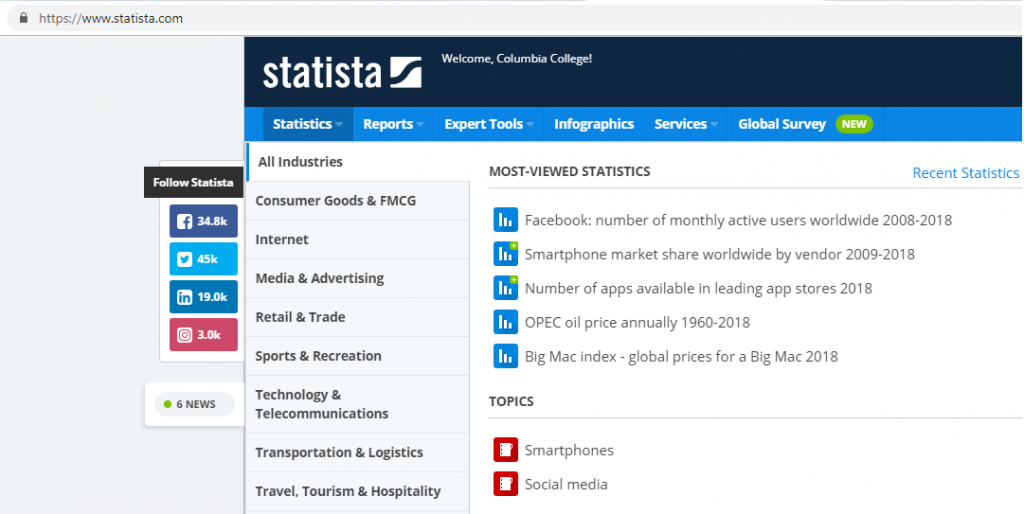
Look under “Statistics” in the top banner to see the most common topics:

Select the topic you are interested in for example “Travel, Tourism & Hospitality.” A list of more specific topics will appear:

Once you have selected a more specific topic (e.g. Global Tourism), you can find useful charts and graphs on that topic. The source of each graph is provided along with a link to that source.
For example:

Along with the data, there is a citation tool to help you cite the chart in your required citation method (e.g. APA, MLA, etc).

Method 2: Using the search bar
Enter keywords related to your topic in the search bar

Hit enter or click on “statista search” to search.
Browse the results and use the filters on the right hand side to limit to the types of sources you’re interested in. For example, statistics, infographics, or reports.

From there, you can browse your search results. Not finding anything? Try changing, deleting or adding keywords.
Have questions about using Statista? Talk to a Librarian!


